Transforms
Overview
Teaching: 10 min
Exercises: 15 minQuestions
How can we write short expressions to change the data in a column?
What is the difference between Common Transforms and Transforms?
How can I use multiple expressions together?
Objectives
Use Common Tranforms to get rid of white space and change data type.
Use Transforms to get rid of unnecessary characters.
Use the History to reuse GREL scripts.
Transforms
Transforms are the most powerful part of OpenRefine. They allow you to interact with your data in more specific ways than just the built-in tools and let you write custom expressions. Once you have written an expression, it gets saved in your History and you can reuse and modify the expression. You can also save all or a selection of your steps and apply them to other datasets.
Common transforms
OpenRefine includes a set of built-in transforms that people use regularly. This is not an exhaustive list, just one that has been built from experience by the community. You can perform these transforms using GREL as well, especially if you want need to combine functions, they are just there for easy access. We will talk about a couple of them in the next section.
Trim leading and trailing whitespace
Words with spaces at the beginning or end are particularly hard for we humans to tell from strings without, but the blank characters will make a difference to the computer. We usually want to remove these. OpenRefine provides a tool to remove blank characters from the beginning and end of any entries that have them.
- Create a new text facet for the column
respondent_wall_type. You should see some choices that appear identical (burntbricksandmuddaubboth have two choices). In reality, one of these choices includes either leading or trailing whitespace. - To remove the whitespace, choose
Edit cells>Common transforms>Trim leading and trailing whitespace. - You should now see only four choices in your text facet.
Changing the data type
You may have data that is saved in one type that you would like to interact with as another type. You can change each cell individually in the edit menu, but you can also change the entire column at once using Common Transforms.
Numbers
When a table is imported into OpenRefine, all columns are treated as having text values. We saw earlier how we can sort column values as numbers, but this does not change the cells in a column from text to numbers. Rather, this interprets the values as numbers for the purposes of sorting but keeps the underlying data type as is. We can, however, transform columns to other data types (e.g. number or date) using the Edit cells > Common transforms feature. Here we will experiment changing columns to numbers and see what additional capabilities that grants us.
Be sure to remove any Text filter facets you have enabled from the left panel so that we can examine our whole dataset. You can remove an existing facet by clicking the x in the upper left of that facet window.
To transform cells in the years_farm column to numbers, click the down arrow for that column, then Edit cells > Common transforms… > To number. You will notice the years_farm values change from left-justified to right-justified, and black to green in color.
Exercise
Transform three more columns,
no_members,yrs_liv, andbuildings_in_compound, from text to numbers. Can all columns be transformed to numbers? - Try it withvillagefor example.Solution
Only observations that include only numerals (0-9) can be transformed to numbers. If you apply a number transformation to a column that doesn’t meet this criteria, and then click the
Undo / Redotab, you will see a step that starts withText transform on 0 cells. This means that the data in that column was not transformed.
Numeric facet
Sometimes there are non-number values or blanks in a column which may represent errors in data entry and we want to find them.
We can do that with a Numeric facet.
Exercise
- For a column you transformed to numbers, edit one or two cells, replacing the numbers with text (such as
abc) or blank (no number or text).- Use the pulldown menu to apply a numeric facet to the column you edited. The facet will appear in the left panel.
- Notice that there are several checkboxes in this facet:
Numeric,Non-numeric,Blank, andError. Below these are counts of the number of cells in each category. You should see checks forNon-numericandBlankif you changed some values.- Experiment with checking or unchecking these boxes to select subsets of your data.
When done examining the numeric data, remove this facet by clicking the x in the upper left corner of its panel. Note that this does not undo the edits you made to the cells in this column. Use the Undo / Redo function to reverse these changes.
Dates
Exercise
For this exercise we will be looking at the
interview_datecolumn.
Is the column formatted as Text or Date?
Use a faceting to find out how many different
interview_datevalues there are in the survey results.Can you use faceting to produce a timeline display for
interview_date? Hint: You will need to useEdit cells>Common transforms>To dateto convert this column to dates.During what period were most of the interviews collected?
Solution
For the column
interview_datedoFacet>Text facet. A box will appear in the left panel showing that there are 19 unique entries in this column. By default, the columninterview_dateis formatted as Text. You can change the format by doingEdit cells>Common transforms>To date. Notice the the values in the column turn green. DoingFacet>Timeline facetcreates a box in the left panel that shows a histogram of the number of entries for each date.Most of the data was collected in November of 2016.
Transforming data with GREL
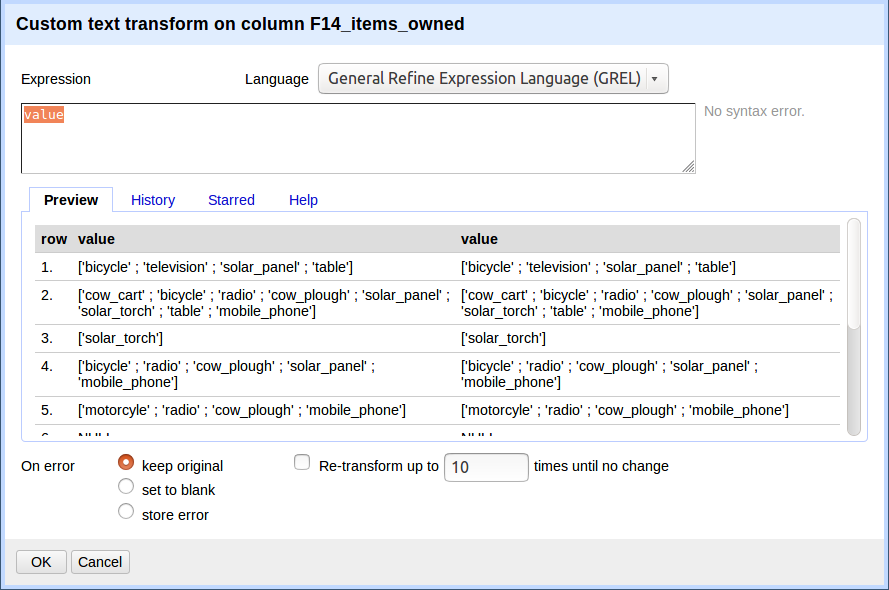
The data in the items_owned column is a set of items in a list. The list is in square brackets and each item is in single quotes. Before we split the list into individual items in the next section, we first want to remove the brackets and the quotes.
- Click the down arrow at the top of the
items_ownedcolumn. ChooseEdit Cells>Transform... - This will open up a window into which you can type a GREL expression. GREL stands for General Refine Expression Language.
-
First we will remove all of the left square brackets (
[). In the Expression box typevalue.replace("[", "")and clickOK. -
What the expression means is this: Take the
valuein each cell in the selected column and replace all of the “[” with “” (i.e. nothing - delete). -
Click
OK. You should see in theitems_ownedcolumn that there are no longer any left square brackets.
Exercise
Use this same strategy to remove the single quote marks (
'), the right square brackets (]), and spaces from theitems_ownedcolumn.Solution
value.replace("'", "")value.replace("]", "")value.replace(" ", "")You should now have a list of items separated by semi-colons (;).
Now that we have cleaned out extraneous characters from our items_owned column, we can use a text facet to see which items
were commonly owned or rarely owned by the interview respondents.
- Click the down arrow at the top of the
items_ownedcolumn. ChooseFacet>Custom text facet... - In the
Expressionbox, typevalue.split(";"). - Click
OK.
You should now see a new text facet box in the left-hand pane.
Exercise
Which two items are the most commonly owned? Which are the two least commonly owned?
Solution
Select
Sort by:count. The most commonly owned items are mobile phone and radio, the least commonly owned are cars and computers.
Exercise
Perform the same clean up steps and customized text faceting for the
months_lack_foodcolumn. Which month(s) were farmers more likely to lack food?Solution
All four cleaning steps can be performed by combining
.replacestatements. The command is:value.replace("[", "").replace("]", "").replace(" ", "").replace("'", "")This can also be done in four separate steps if preferred. November was the most common month for respondents to lack food.
Exercise
Perform the same clean up steps for the
months_no_water,liv_owned,res_change, andno_food_mitigationcolumns. Hint: To reuse a GREL command, click theHistorytab and then clickReusenext to the command you would like to apply to that column.
Key Points
Common Transforms are a great first step in cleaning up data.
You can write simple transforms in GREL and reuse them from the History tab.
Check to see if someone else has needed to do the same thing as you, you might be able to use their GREL.