Formatting data tables in Spreadsheets
Overview
Teaching: 15 min
Exercises: 15 minQuestions
What are some common challenges with formatting data in spreadsheets and how can we avoid them?
Objectives
Recognise and resolve common spreadsheet formatting problems.
Describe the importance of metadata.
Identify metadata that should be included with a dataset.
Data formatting problems
Spreadsheet Basics
You may have used spreadsheets in your research, work, or even personal life and not really considered how they work or why it is important to carefully think about how they are formatted. Spreadsheet software (like Excel) allows us to use color, notes, merged cells, and other kinds of formatting to make the data human-readable, but this makes it harder or impossible for the computer to understand. In this session we will talk about some common data formatting issues and how we can avoid them so that our data is as usable and reusable as possible.
Components to know about
The most basic parts of an individual spreadsheet are the columns, rows, and cells.
Columns are the vertical sections of the spreadsheet labeled with letters. They should contain data that belongs to a particular variable that you are measuring (like the name of the town or number of livestock in our example. They should start with a heading that indicates what type of data and unit of measure is represented in the column. It is not good practice to rely on knowing what letter the column is, as this can change if columns are added/removed/moved.
Rows are the horizontal sections of the spreadsheet labeled with numbers. They contain all of the data for one observation, whatever that may be (in the case of our example it would be for one household). In other kinds of software these are sometimes called records. Good practice is to have at least one piece of information per observation that is unique to that particular row.
Cells are the smallest component of a spreadsheet. A cell represents the data in one variable for one unit of observation. It is identified by the column letter and row number (for example, A1 is the first cell in the first column).
We’re going to be working with data from a study of agricultural practices among farmers in two countries in eastern sub-Saharan Africa (Mozambique and Tanzania). We will introduce the data a little later, but for now we will look at an excerpt as an example.
Exercise
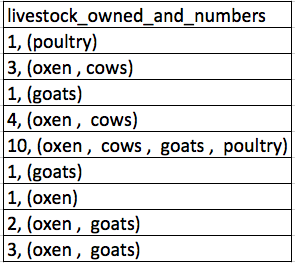
Consider this table:
If we consider the best practices we talked about above, one problem is that number of livestock and type of livestock are in the same field. So, if they wanted to look at the average number of livestock owned, or the average number of each type of livestock, it would be hard to do this using this data setup. If instead we put the count of each type of livestock in it’s own column, this would make analysis much easier. The rule of thumb, when setting up a datasheet, is that each variable (in this case, each type of livestock) should have its own column, each observation should have its own row, and each cell should contain only a single value.
Solution
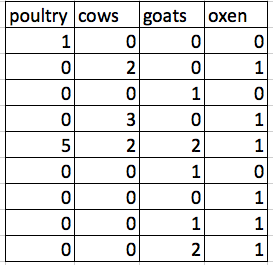
The example above should look like this:
Notice that this now allows us to make statements about the number of each type of animal that a farmer owns, while still allowing us to say things about the total number of livestock. All we need to do is sum the values in each row to find a total. We’ll be learning how to do this computationally and reproducibly later in this workshop.
Tip
The best layouts/formats (as well as software and interfaces) for data entry and data analysis might be different. It is important to take this into account, and ideally automate the conversion from one to another.
Keeping track of your analyses
When you’re working with spreadsheets, during data clean up or analyses, it’s very easy to end up with a spreadsheet that looks very different from the one you started with. In order to be able to reproduce your analyses or figure out what you did when Reviewer #3 asks for a different analysis, you should
- create a new file or tab with your cleaned or analyzed data. Don’t modify the original dataset, or you will never know where you started!
- keep track of the steps you took in your clean up or analysis. You should track these steps as you would any step in an experiment. You can do this in another text file, or a good option is to create a new tab in your spreadsheet with your notes. This way the notes and data stay together.
Put these principles in to practice today during the exercises.
The Data for this Exercise
The dataset that will be used in this lesson, and in the other Social Sciences lessons, is the Studying African Farmer-led Irrigation (SAFI) Dataset.
The dataset was compiled from interviews of farmers in two countries in eastern sub-Saharan Africa (Mozambique and Tanzania). These interviews were conducted between November 2016 and June 2017 and probed household features (e.g. construction materials used, number of household members), agricultural practices (e.g. water usage), and assets (e.g. number and types of livestock).
This is a real dataset, however, it has been simplified for this workshop. If you’re interested in exploring the full dataset further, but you can download it from Figshare and work with it using exactly the same tools we’ll learn about today.
For more information about the dataset and to download it from Figshare, check out the Social Sciences workshop data page.
LibreOffice Users
The default for LibreOffice is to treat tabs, commas, and semicolons as delimiters. This behavior can cause problems with both the data for this lesson and other data you might want to use. This can be fixed when opening LibreOffice by deselecting the “semicolons” and “tabs” checkboxes.
Spreadsheet Best Practices Recap
The cardinal rules of using spreadsheet programs for data:
- Put all your variables in columns - the thing you’re measuring, like ‘weight’ or ‘temperature’.
- Put each observation in its own row.
- Don’t combine multiple pieces of information in one cell. Sometimes it just seems like one thing, but think if that’s the only way you’ll want to be able to use or sort that data.
- Leave the raw data raw - don’t change it! Save your changes in a new version of your spreadsheet
- Export the cleaned data to a text-based format like CSV (comma-separated values) format. This ensures that anyone can use the data, and is recommended/required by most data repositories.
Exercise
We’re going to take a poorly-formatted version of the SAFI data and describe how we would adjust it to fit our best practices.
- Download the poorly formatted data.
- Open up the data in a spreadsheet program.
- Notice that there are two tabs. Two researchers conducted the interviews, one in Mozambique and the other in Tanzania. They both structured their data tables in a different way. Now, you’re the person in charge of this project and you want to be able to start analyzing the data.
- Start by identifying three things this data set does well, that you would like to preserve in future changes.
- Why do you think the two countries sheets were different? What factors affect data entry?
- Your first task is to compare the number of poultry held in the Mozambique sample to the Tanzania sample. With the person next to you, take 2 minutes and find the total for each country.
Important Do not forget our first piece of advice, to create a new file (or tab) for the cleaned data, never modify your original (raw) data.
After you go through this exercise, we’ll discuss as a group what was wrong with this data and how you would fix it.
Solution
- Take about 5 minutes to work and 5 minutes to discuss. [Insert answer]. Discuss challenges in comparing the different formats.
- All the mistakes listed in the next episode are present in the messy dataset. If this exercise is done during a workshop, ask people what they saw as wrong with the data. As they bring up different points, you can refer to the next episode or expand a bit on the point they brought up. Data is contextual. How people gather it matters. Different people gather it! This sounds obvious, but data is a representation of reality in this context: the person may have counted the poultry, or they may have had self-reported data from someone working on a dowry, or they may have been told “yes” rather than a number, and been unable to get different information.
Handy References
Two excellent references on spreadsheet organization are:
- Karl W. Broman & Kara H. Woo, Data Organization in Spreadsheets, Vol. 72, Issue 1, 2018, The American Statistician.
https://www.tandfonline.com/doi/full/10.1080/00031305.2017.1375989
- Hadley Wickham, Tidy Data, Vol. 59, Issue 10, Sep 2014, Journal of Statistical Software. http://www.jstatsoft.org/v59/i10
Metadata
At the most basic level, metadata are data about data. If created thoughtfully, metadata will provide whoever is using the data in future (including you!) with key pieces of information about who, what, when, where, why, and how the data were created. Appropriate metadata means that other people can have confidence when they reuse your data or replicate your work.
Metadata exists at multiple levels, some of which are created by the software you are using to create or keep track of your files and some of which you will need to create yourself.
Study-Level Metadata
Metadata at the study-level will tell others who use your data about the broader context in which the data were collected. This includes documentation like a description of your research question(s), the time period over which you completed the study, and any team members involved. It also includes details about the instruments and protocols used to collect the data, how different datasets that were part of the study were used in combination, and any steps you took to clean up or manipulate the data. This information is usually part of the code-book, or it can be in extra files with the code you used .
File-Level Metadata
File-level metadata is the key to being able to find and access your data without having to open and close half of the things on your hard-drive to get what you need. At the most basic level, it includes how you structure and name your folders and files. This is probably something you do as the need arises - you get a new dataset and decided whether to put it in an existing folder or to create a new one. As your project goes on and your files proliferate it becomes even more important to have a plan for keeping track of everything, and if you create that plan at the beginning you won’t have to move things around later.
A README file, a text document where you write down your folder and file naming conventions, will help you and whoever needs to use the data after you understand which files to use. You can get tips on naming your files and folders from the Center for Open Science here: http://help.osf.io/m/bestpractices/l/609932-file-naming.
Variable-Level Metadata
The bulk of your code book will contain metadata about the variables and observations in your dataset(s). This includes things like any codes that you used in your data (even if you think they are obvious you should still document them!), the units of each variable (for example, is it currency, total numbers, percentages, etc.), or which survey questions relate to which columns in your dataset. More information on making a data dictionary from the Center for Open Science can be found here: http://help.osf.io/m/bestpractices/l/618767-how-to-make-a-data-dictionary.
Metadata are most useful when they follow a standard. For example, the Data Documentation Initiative (DDI) provides a standardized way to document metadata at various points in the research cycle. Research librarians may have specific expertise in this area, and can be helpful resources for thinking about ways to purposefully document metatdata as part of your research.
(Text on metadata adapted from the online course Research Data MANTRA by EDINA and Data Library, University of Edinburgh. MANTRA is licensed under a Creative Commons Attribution 4.0 International License.)
Exercise
Download a clean version of this dataset and open the file with your spreadsheet program. This data has many more variables that were not included in the messy spreadsheet and is formatted according to tidy data principles.
Discuss this data with a partner and make a list of some of the types of metadata that should be recorded about this dataset. It may be helpful to start by asking yourself, “What is not immediately obvious to me about this data? What questions would I need to know the answers to in order to analyze and interpret this data?”
Solution
Some types of metadata that should be recorded and made available with the data are:
- the exact wording of questions used in the interviews (if interviews were structured) or general prompts used (if interviews were semi-structured)
- a description of the type of data allowed in each column (e.g. the allowed range for numerical data with a restricted range, a list of allowed options for categorical variables, whether data in a numerical column should be continuous or discrete)
- definitions of any categorical variables (e.g. definitions of “burntbricks” and “sunbricks”)
- definitions of what was counted as a “room”, a “plot”, etc. (e.g. was there a minimum size)
- learners may come up with additional questions to add to this list
Key Points
Never modify your raw data. Always make a copy before making any changes.
Keep track of all of the steps you take to clean your data.
Organize your data according to tidy data principles.
Record metadata in a separate plain text file.